Stock Management and El Niño: Anticipating the Impact with Mining
Facing El Niño 2026–2027, the question almost nobody is asking is the only one that matters: can you actually reach the demand?
 Jose Luis Romero · Process Mining Expert
There’s a scene that repeats every critical season. A company reviews its stock levels, confirms it has three months of coverage, and breathes easy. Weeks later, that same inventory is still sitting untouched in the warehouse while the customer buys somewhere else.
Product wasn’t the problem. The road was.
Facing El Niño 2026–2027, the question almost nobody is asking is the only one that matters: can you actually reach the demand?
This article isn’t a climate contingency plan. It’s a concrete proposal to answer that question with evidence instead of intuition, using data your company already generated and probably never read.
+90% probability of a very strong event, according to NOAA · 47% of Manabí’s state road network in irregular condition · ~90 days until the projected phase of highest intensity
Inventory Isn’t the Problem
Facing a critical season, the instinctive reaction is to buy stock. It’s visible, it’s measured in units, and it reassures a board in fifteen minutes.
But inventory only solves one variable in the equation. Three months of stock in a warehouse served by a single-access road corridor isn’t a position of strength — it’s working capital tied up exactly when you’ll need it to hire emergency transport, advance payment to a backup supplier, or set up a temporary distribution point.
The question isn’t how much stock to secure. It’s how far you can reach with what you already have.
The Three Last Miles
I’m proposing a simple framework. These aren’t three stages of a linear sequence, but three final miles that fail independently. It only takes one breaking for the other two to lose their value.
Mile 1: Sourcing. The ability to keep receiving what the operation needs to produce or sell.
- Concentration in a single supplier with no approved alternatives
- Imported inputs that depend on one specific port or corridor
- Small suppliers without the financial muscle to absorb a two-month shock
Mile 2: Distribution. The physical ability to move product from where it is to where it’s sold.
- Distribution centers in low-lying or historically flood-prone areas
- Routes with a single mandatory chokepoint and no viable detour
- Outsourced fleet with no contractual commitment to emergency priority
Mile 3: Execution. The ability to decide and act fast when the scenario changes. It’s the least-planned mile and the one that determines the outcome the most.
- Nobody has clear authority to decide without checking upward
- Field information reaches the decision table 48 hours late
- No predefined thresholds exist, so every decision gets debated from scratch
The operational question is simple: which of the three would limit your response capacity today?
Most companies answer it in a meeting, by consensus and by gut feeling. Each department points to the mile that isn’t theirs. Minutes get taken, owners get assigned, and nobody walks away with an answer they can defend with evidence.
How it’s decided today: by consensus in a room. Each manager estimates their exposure from their own perception. The result depends on who speaks loudest, not on what’s actually most fragile.
How it should be decided: with evidence pulled from the systems. Real cycle times, effective supplier lead times, and exposure calculated by zone, route, and customer.
The Answer Is Already Written in Your Systems
Every purchase order, every delivery note, every warehouse movement, and every delivery leaves a record with a date, time, user, and status. Your ERP, your WMS, and your TMS have spent years accumulating the complete biography of your operation.
Nobody reads it, because reading it by hand is impossible. That’s exactly the job of process mining and data mining.
Process Mining: An X-Ray of How It Actually Operates
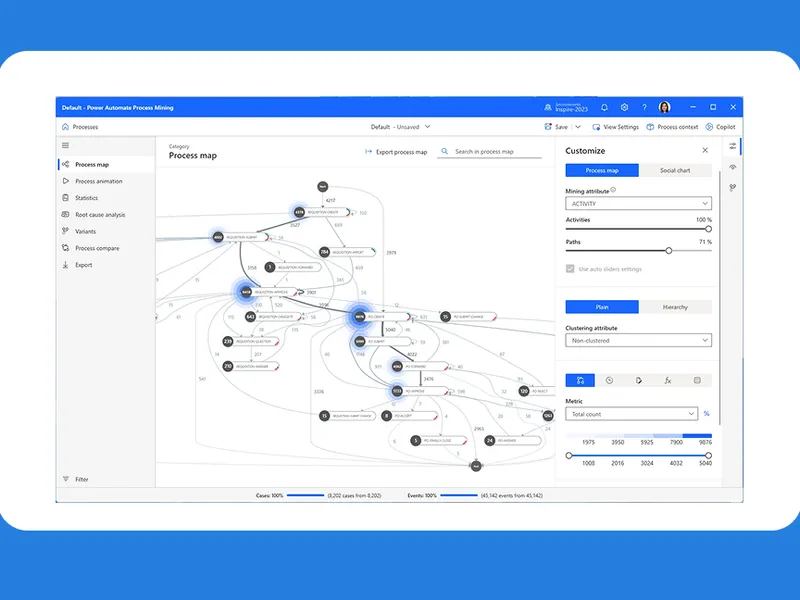
Process mining reconstructs the real process from your systems’ event records. Not the process from the manual — the one that actually happens.
When the two are compared, the same thing almost always shows up. The designed flow has six steps, and reality has dozens of variants, a handful of which account for all the delays.
What it answers in the face of El Niño:
- Real cycle time from order to delivery, by zone, corridor, and customer. Not the overall average, which hides precisely the critical cases.
- Where the hours are lost: staging, waiting for transport, transit, unloading, or paperwork.
- How much slack each step has before an order arrives late. That margin is your real cushion against a road closure.
- What percentage of deliveries already depend on a rework loop or a manual exception only one person knows how to run.
- Effective lead time per supplier, measured on executed orders rather than the contractual commitment.
That last point is the one that surprises people most. Many companies discover that their “15-day” supplier only actually delivers in 15 days a fraction of the time, and that the rest of the cases are already living on the edge.
When it rains, that supplier isn’t going to fail because of El Niño. They’re going to fail beforehand, and the data was already warning you.
Data Mining: The Forecast of Your Own Demand
If process mining looks inward, data mining looks forward. It searches for patterns in historical and external data to anticipate what’s going to happen, and where.
There’s an advantage here that few companies use: Ecuador has already lived through this. The 1997–1998 and 2015–2016 events left data behind. If your company was operating then, you have a set of real cases of what happens when it truly rains.
What it answers in the face of El Niño:
- How demand shifted by SKU and zone in previous events: which categories spiked, which dropped, and with how much lead time.
- Which customers and routes concentrate the risk, by cross-referencing your historical failed deliveries with rainfall data and known chokepoints in the road network.
- Which suppliers show early deterioration: growing variability in lead times, changes in billing patterns, partial non-compliance.
- How to group your points of sale by real vulnerability, not by sales region. Two stores in the same province can have opposite exposures.
- What advance inventory is justified in each zone, calculated based on probability of isolation rather than a flat coverage rule.
One tells you where you’re standing. The other tells you where the ground is heading.
How It’s Done, in Four Steps
The usual fear is that this sounds like a twelve-month data project. It isn’t, because it doesn’t build anything new — it reads what already exists.
- Extraction. Event records from ERP, WMS, and TMS from the last three to five years are pulled. Without touching your production systems and without opening an integration project.
- Reconstruction of the real process. The end-to-end flow is assembled and compared against the designed one. This is where hidden variants, bottlenecks, and undocumented reworks show up.
- Predictive modeling. Internal data is cross-referenced with rainfall series, historical ENSO events, and road network status to estimate exposure by zone, route, and customer.
- Prioritization by protected revenue. Interventions are ranked by how much sales they protect. Not a list of a hundred findings — the five decisions that move the needle before December.
Three Reasonable Objections
“My data is dirty.” Everyone’s is. Process mining works on timestamps and statuses, which are exactly the fields a transactional system records well because it needs them to function. The mess is usually in the descriptions, not the dates.
“I don’t have time for a data project.” That’s exactly why the order matters. A diagnosis like this gets resolved in weeks, not quarters. And the time it consumes is a fraction of what you’ll lose deciding blind in January.
“This is for big companies.” It’s the other way around. A big company survives a bad diagnosis because it has the financial muscle to fix it. A mid-sized one doesn’t. If you’re going to make one capital bet before December, it should be the right one.
The Window Is Closing on Its Own
NOAA keeps its El Niño advisory active, with more than a 90% probability of a very strong event. The ERFEN Committee projects the highest-intensity phase between December 2026 and February 2027, and Ecuador already operates under an orange alert with the National COE active. In Manabí, nearly 47% of the state road network is in irregular condition before the rain even starts.
There are roughly ninety days left, and every week makes the same decisions more expensive. Hiring transport capacity today costs a fraction of what it will cost in December, when the whole industry is competing for the same fleet. Approving a backup supplier now is an administrative step; in January, it’s a negotiation from weakness.
The companies that get through this period best won’t be the ones with the most inventory. They’ll be the ones who know, with evidence rather than intuition, which of their three last miles was going to break first.
That evidence is already in your systems. You just have to go find it.
Climate and infrastructure context sources: NOAA Climate Prediction Center, Comité Nacional para el Estudio Regional del Fenómeno de El Niño (ERFEN), Ecuador’s National Risk Management Secretariat, and the Ministry of Transport and Public Works.